


In the world of tech, retention rates are critical — they offer insights into customer loyalty, product-market fit, and the long-term viability of a business model.
But they’re also one of the trickiest to understand. One common question we get all of the time is what a good retention is.
The answer is that it depends — different industry verticals possess different retention rates due to the nature of their products and how consumers engage with them. For example, how often someone buys a house vs loads up TikTok or YouTube.
In reality, what matters is how a company’s retention rate compares to that of the incumbents in its space, otherwise known as its structural retention rate.
What Are Structural Retention Rates?
Structural retention rates are a baseline level of customer retention that is typical for a specific industry or business model. These rates are influenced by factors such as the frequency of use, switching costs, and the necessity of the product or service. Incumbents manage their businesses (both explicitly and implicitly) to that rate, making it difficult for a company or product with a lower retention rate to succeed.
Generally there are two factors that most commonly influence retention rates:
- Category
- Business model
Category
Categories have different retention rates because consumers have different frequencies of use. Compare groceries to electronics stores:
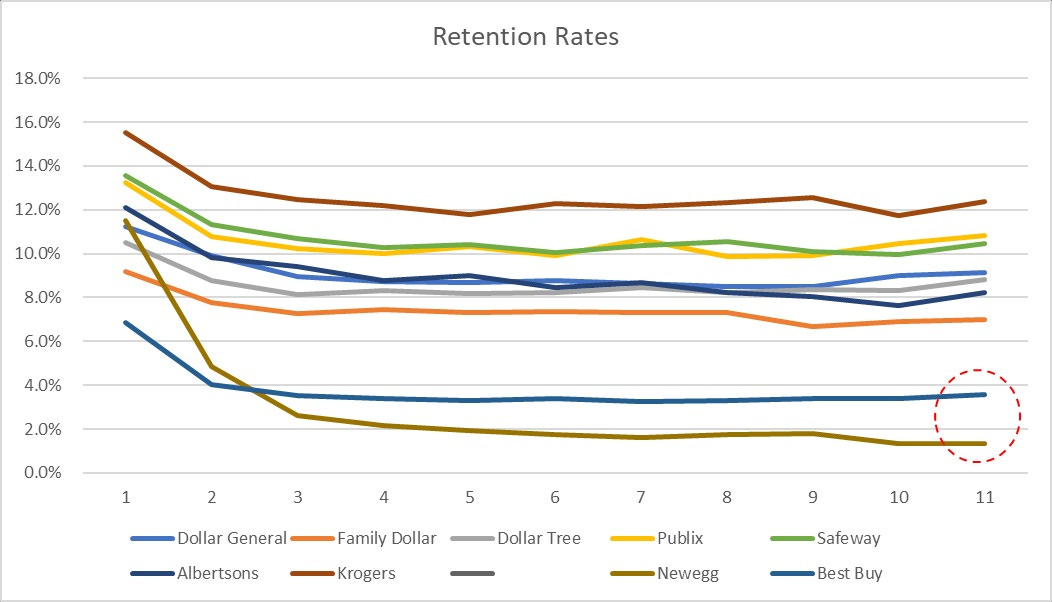
Groceries have a higher retention rate than electronics do, even though both are broadly categorized as retail. Best Buy has a 3x lower retention rate than some grocery chains, but that doesn’t mean that it’s a bad business — it’s a $19B market cap company. Albertsons, with a ~2x higher retention rate, sports a smaller market cap, at $11B.
Comparing retention rates between companies of two different categories can be misleading, giving the impression of a low or high retention rate, when in fact an accurate reference point would have painted a different picture.
A more accurate comparison is to compare within a category. Take the example of Newegg and Best Buy: Newegg has long-term retention rates at 1-2% while Best Buy is at 3-4% — that difference, alongside other business model differences, contributes to a drastic difference in market caps ($19B vs $225M). A small difference in retention rates can lead to large differences in value creation.
Apparel retailers are another example:
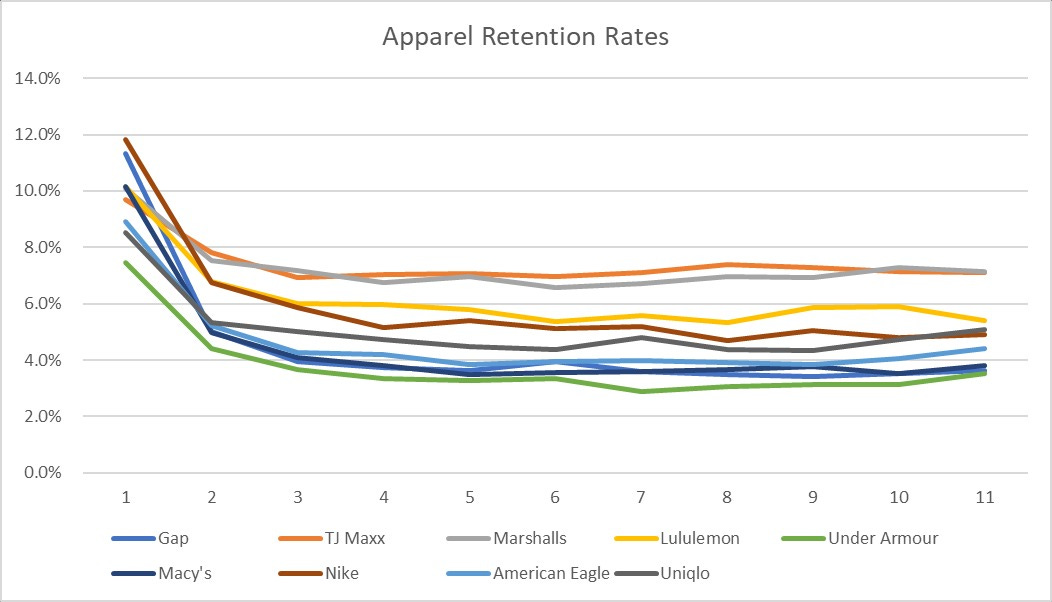
Even with the varying sizes of the companies, from single-digit billions to hundreds of billions, all of them reside within a similar band of retention in the mid-single digits. The structural retention rate of apparel is within this mid-single digit range. New entrants likely need to match this rate to have a chance of success.
While dangerous to rely on a single regression, companies that are able to maintain a higher retention relative to their category also have a higher chance of a higher market cap:
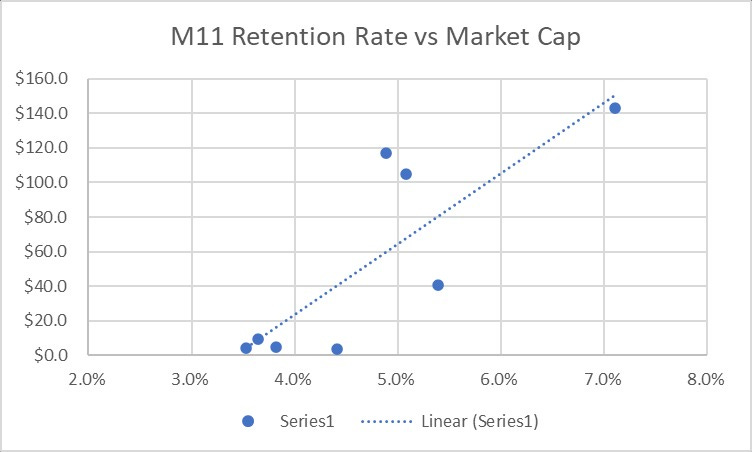
Even though the above analysis centers on retail, a similar dynamic exists across many verticals.
Generally what we see for monthly cohort rates for a sampling of categories:
- Grocery Stores ~5-15% at M12
- Retail ~1-5% at M12
- Banking / Credit at~ 60-70% at M12
- Remittance at ~20-30% at M12
- Workplace Tools at ~40-50% M12
- Travel (Hotels/OTAs) at ~1-5% M12:
Business model
Within the same category, retention rates differ by business model. The purest business model is a completely free model, where a service is available free of charge; however, in reality, the vast majority of industries have a direct payment relationship with the customer / consumer.
The most common variation in business model are generally found in two buckets:
- Subscription
- Microtransactions
The selection of business model also has a large effect on how users retain. We can examine media subscription services versus IAP services to get an idea of the possible difference between the two:
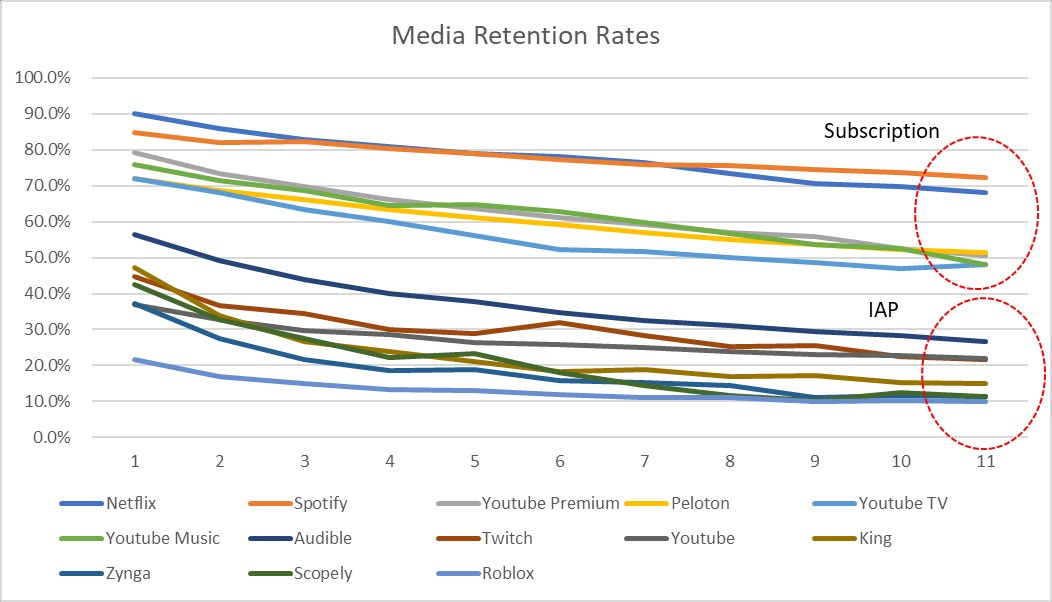
We can see that Media IAP companies are lower by up to a factor of 2-3x. However, that difference doesn’t necessarily preclude large companies being built with that model — there are plenty of examples of sizable businesses being built off of IAP (video games are the most prevalent example).
Summary
The above discussion hopefully reinforces the point that a retention rate needs to be viewed in relation to both its industry and business model, and that a standalone retention rate when viewed in a vacuum may not be helpful (and possibly misleading with the wrong mental anchor point).
One important point to note is that retention rates are only one piece of the whole metrics puzzle — a similar issue exists with CACs, ARPUs, etc. It is only when the other metrics are within normal ranges as well that having a retention rate that matches or exceeds the structural retention rate of related incumbents give a company an opportunity to compound value over time.
When thinking about retention rates, think first:
- What is the category that my product is in, and what is the use case that my product is providing?
- What is the business model that I have attached to that product?
These two questions can help in finding the relevant structural retention rate to compare to, and as a result can inform what the possible next step(s) are in the product’s lifecycle or company strategy.